
Velocity based training: an evidence-based guide for coaches
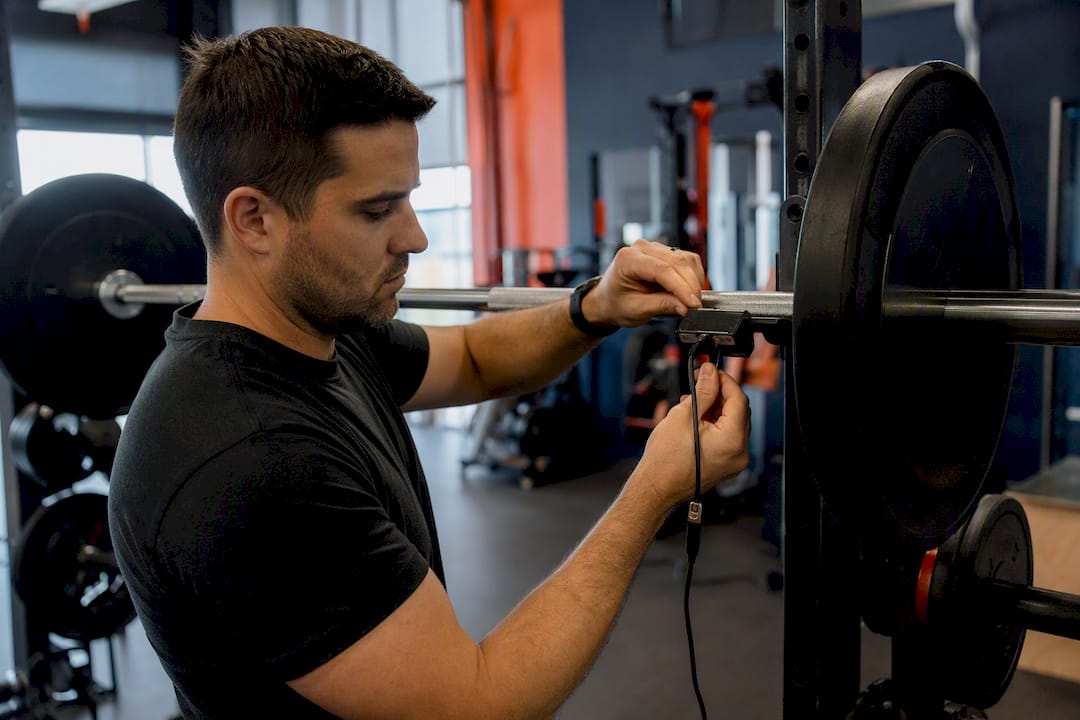
Velocity based training (VBT) uses real-time movement speed to objectively prescribe and autoregulate resistance training. It gives coaches an immediate, numerical measure of an athlete’s readiness and an evidence-based way to control intensity and volume, session to session, rather than relying on how heavy a bar feels.
The principal benefit is autoregulation. Instead of assuming an athlete’s 1RM stays fixed week to week, VBT measures bar speed on every rep and adjusts load or volume based on what the body can actually produce that day. Practitioners consistently point to readiness monitoring as VBT’s most practical value, precisely because bar speed reveals fatigue that RPE and percentage charts miss.
What can you do with this in your very first session? Quite a lot:
- Attach a linear position transducer or accelerometer to the bar and record velocity on a few submaximal warm-up sets.
- Compare today’s speed at a given load against the athlete’s known average.
- Add or strip load in small increments if the number is meaningfully faster or slower than expected.
- Log the numbers so next week’s session has a baseline to compare against.
That is the entire loop. Everything else in this guide is about doing it with more precision.
Key Takeaways
Velocity based training works because it replaces assumed intensity with measured intensity, giving coaches an objective daily readiness signal that fixed percentages and subjective effort scores cannot provide.
| Point | Details |
|---|---|
| Velocity reveals daily readiness | Bar speed at a known load exposes fatigue that percentage-based programming cannot detect. |
| Build exercise-specific profiles | Test 3 to 6 submaximal loads per lift and never assume one profile transfers to another exercise. |
| Match VLT to training goal | Use 5 to 10% loss for power and 10% for strength blocks. |
| Validate your device first | Compare any new tool against a trusted reference at light, moderate, and heavy loads before trusting it. |
| Measure V1RM, don’t assume it | Individual and exercise-specific testing beats applying textbook velocity thresholds blindly. |
1What is velocity based training and why does speed matter?
Velocity based training is a method of prescribing and monitoring resistance exercise using the speed of the bar or implement, measured in metres per second (m·s⁻¹), rather than relying solely on a percentage of one-rep max. Three metrics dominate the practice, and confusing them is one of the quickest ways to misread your data.
- Mean velocity (MV) is the average speed across the entire concentric phase of a rep, from the first sign of movement to full extension. It is the most commonly reported metric because most commercial devices calculate it by default.
- Mean propulsive velocity (MPV) only counts the portion of the rep where the bar is actually being accelerated against gravity. Once deceleration begins, that phase is excluded. MPV tends to correlate more tightly with maximal strength qualities, particularly at heavier loads where athletes decelerate earlier to control the bar.
- Peak velocity (PV) is the single highest instantaneous speed reached during the rep. It is useful for explosive, ballistic movements such as jump squats or speed deadlifts, where the moment of peak output matters more than the average.
The reason velocity matters at all comes down to a well-documented relationship: as load increases, velocity decreases, in a pattern that is close to linear across most of the loading spectrum. This is the load–velocity relationship, and it is the backbone of everything VBT does. Because the relationship holds fairly consistently for an individual on a given exercise, you can use velocity at submaximal loads to estimate where true maximal strength sits, a concept known as V1RM, the velocity typically observed at a true one-rep maximum.
A useful comparison: a 100kg back squat performed at 0.55 m·s⁻¹ by a fresh, well-rested athlete is a fundamentally different training stimulus to the same 100kg squat performed at 0.38 m·s⁻¹ by a fatigued athlete, even though the load on the bar hasn’t changed at all. Percentage-based programming cannot see this difference. RPE can sense it subjectively, but velocity measures it directly, in numbers you can chart and compare week to week.
That contrast is really the whole argument for VBT. Percentage-based systems assume a fixed 1RM and therefore treat every Monday’s 80% the same, regardless of sleep, soreness, or accumulated fatigue. RPE captures fatigue but depends on the athlete’s subjective scoring, which varies with experience and mood. Velocity gives you an objective third measure that sits alongside both, not a replacement for either.
2Which devices measure velocity, and how accurate are they?
Three broad device classes dominate current practice, and each comes with real trade-offs in cost, precision, and practicality that will shape how you use the data.
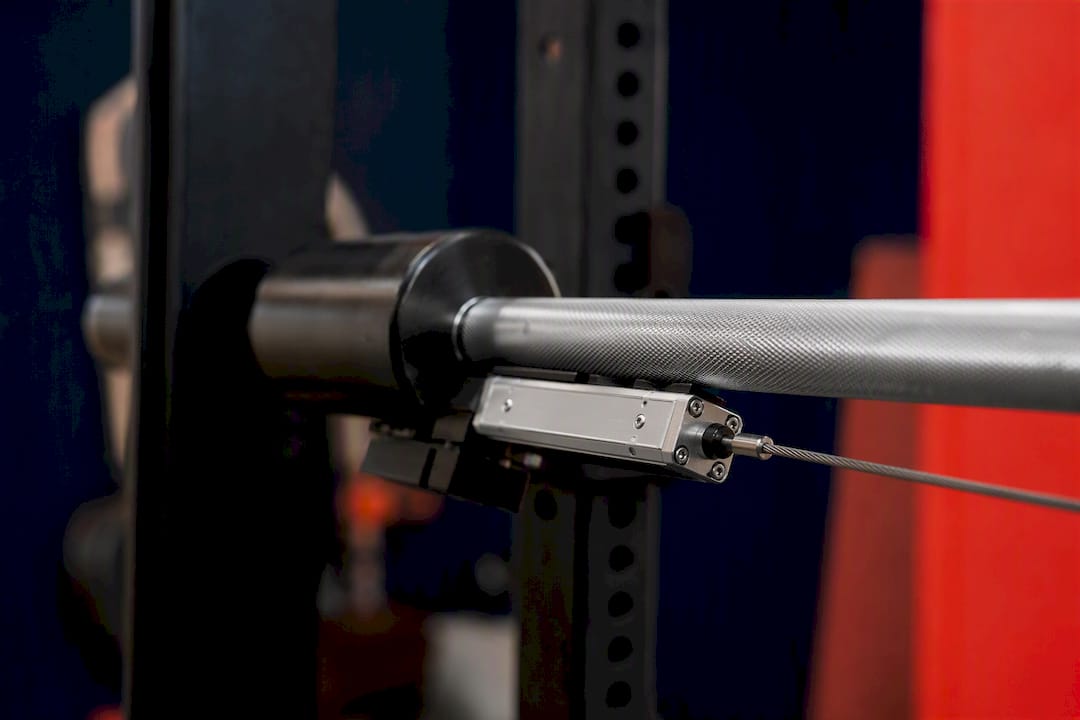
Linear position transducers (LPTs) attach a cable to the bar and measure displacement over time to calculate velocity. They remain the closest thing to a gold standard for positional accuracy in a gym setting, largely because they measure the bar’s path directly rather than inferring it. The trade-off is portability: cables, stands, and calibration routines make LPTs slower to set up for large group sessions.
IMU and accelerometer-based wearables clip onto the bar or the athlete and estimate velocity from acceleration data, integrated over time. They’re fast to deploy and often cheaper, which is why they dominate team settings where you need to test fifteen athletes in one session. The catch: accelerometers can show inconsistency at slower speeds and are sensitive to bar vibration, which introduces noise exactly where precision matters most, near maximal loads.
Camera and computer-vision systems track barcode markers or the bar itself through video, calculating velocity from frame-by-frame position changes. They avoid physical attachment altogether, but accuracy depends heavily on camera angle, frame rate, and lighting consistency across sessions. A system that performs well in a well-lit lab can behave very differently in a dim training hall with fluorescent flicker.
Device class isn’t the only variable. Watch for these common sources of measurement error regardless of what you’re using:
- Sampling rate too low to capture fast concentric phases accurately, especially on explosive lifts.
- Bar path deviation on exercises like the squat, where lateral drift confuses displacement-based systems.
- Attachment placement inconsistency, where the sensor sits in a different spot on the bar from one session to the next.
- Vibration artefacts on IMUs during heavy, grinding reps that shake the sensor housing.
- Poor camera framing that clips part of the bar’s travel at the top or bottom of the rep.
Before trusting any device with programming decisions, run a simple validation check: perform the same lift at three known loads (light, moderate, heavy) on both your new device and a trusted reference, ideally an LPT, and compare the velocity outputs. If the numbers track closely across the range, you have a device you can build a load–velocity profile around. If they diverge at heavier loads specifically, that’s exactly where your V1RM predictions will be the least reliable.
Test your device’s repeatability, not just its accuracy. Have the same athlete perform three identical reps at the same load, back to back, and check the velocity spread between them. A device that gives you 0.52, 0.51, and 0.53 m·s⁻¹ is trustworthy; one that gives you 0.52, 0.61, and 0.44 is not, whatever its marketing promises.
3How do you build a load–velocity profile to estimate 1RM?
A load–velocity (L–V) profile plots an athlete’s velocity across a range of submaximal loads on a specific exercise, then uses the resulting line to estimate their current 1RM and to prescribe loads for any target velocity, without a maximal test.
Building one reliably follows a fairly consistent sequence:
- Select the exercise. Profiles are exercise-specific. A squat profile tells you nothing usable about bench press velocities, so build a separate profile for every key lift you intend to monitor.
- Choose your submaximal loads. Most protocols use between 2 and 6 loads spread across a range, commonly something like 40%, 60%, 80%, and 90% of estimated 1RM. More points generally improve the regression, but each added load costs session time and adds fatigue.
- Record velocity at each load, typically the best of 2 to 3 reps per load, using a consistent metric (MV or MPV, chosen once and used consistently).
- Plot load against velocity and fit a linear regression. The line’s slope and intercept describe that athlete’s individual relationship on that exercise.
- Find the V1RM intersection. Extend the regression line to the point where it meets the known or estimated minimal velocity threshold for that lift. That load is your estimated 1RM.
- Use the equation to prescribe loads. Once you know the line, you can work backwards from any target velocity to the load that should produce it, updating prescriptions without a maximal test every week.
Here’s where coaches need real caution. Load–velocity profiling can estimate 1RM from submaximal loads with reasonable practical use, but accuracy varies meaningfully by exercise and by athlete, and exercises with a less linear relationship, or athletes with unusual movement strategies, will produce noisier estimates than the textbook case suggests. Treat any single L–V-derived 1RM as an informed estimate, not a certified number, and re-validate it periodically against genuine testing where safe to do so.
Take a practical example. An athlete squats 60kg at 0.85 m·s⁻¹ and 100kg at 0.55 m·s⁻¹ in a testing session. The resulting regression line suggests their 1RM sits close to 140kg, at the point where velocity would theoretically reach the minimal threshold for that lift. If the coach wants a training day targeting roughly 80% intensity for a strength block, the line tells them exactly what load should produce the corresponding velocity that day, whether that’s 112kg on a fresh week or 106kg on a fatigued one. The load number moves; the velocity target stays the intent.
This is the practical payoff of profiling: two athletes with identical bar loads on the sheet can be training at genuinely different relative intensities, and only velocity data shows you which is which.
4What velocity marks a true 1RM, and does it vary by lift?
The velocity typically observed at a true one-rep maximum is called the minimal velocity threshold, or V1RM, and it is not a universal number. It is specific to the exercise and, to a meaningful degree, specific to the individual performing it.
Published ranges give useful starting points, but they vary enough between lifts that assuming a single figure across your whole programme is a mistake. Squats, bench press, and deadlifts each tend to show their own characteristic V1RM zone, and even within the same lift, two athletes with different limb lengths, technique, or strength qualities can show slightly different thresholds at what is genuinely their maximum effort.
That variability is exactly why the safest practice is to measure, not assume:
- Treat published V1RM ranges as a sensible starting estimate for programming, not a fixed constant to apply blindly to every athlete on your roster.
- Establish each athlete’s own V1RM through a supervised, gradually progressive testing protocol on the specific exercise you plan to monitor.
- Re-test periodically, particularly after a strength block, since V1RM can shift as an athlete’s technique and rate of force development change over a training cycle.
- Never chase a textbook velocity number over an athlete’s visible technical breakdown; safety and bar path always outrank hitting a target figure.
A safe way to find an individual’s V1RM is a standard progressive testing session: warm up thoroughly, then work up through increasing loads in small increments, recording velocity at each, until the athlete reaches a load where they can complete the rep but velocity has dropped to a clear plateau and technical form is starting to strain. That final successful rep, or the load immediately below a failed attempt, gives you the athlete’s practical V1RM on that lift, on that day. Because this figure is athlete and exercise specific, it belongs in the same data log as your load–velocity profile, not as a one-off number you note and forget.
5How does velocity-loss control training volume?
Velocity-loss thresholds (VLTs) use the percentage drop in bar speed within a set, compared to either the fastest rep or the first rep, as a real-time signal to decide when to stop that set and move on.
The mechanism is straightforward. As fatigue accumulates across repetitions, velocity on each subsequent rep drops. Rather than a coach guessing when an athlete has “had enough” for that set, a VLT gives an objective stopping rule: terminate the set once velocity falls by a predetermined percentage from the fastest rep recorded in that set.
The evidence on this is genuinely useful for programming decisions. Velocity-loss thresholds function as an effective in-set volume control, and the size of the threshold you choose should map directly onto your training goal, because different degrees of within-set fatigue drive different adaptations.
| Threshold | Primary goal | Typical application |
|---|---|---|
| 5–10% velocity loss | Power and peaking phases | Low fatigue accumulation, prioritises speed quality, common close to competition |
| 10% velocity loss | Strength and power maintenance | Balances mechanical tension with manageable fatigue, common in in-season strength work |
| — | Hypertrophy | Higher fatigue tolerated deliberately, drives metabolic stress and volume accumulation |
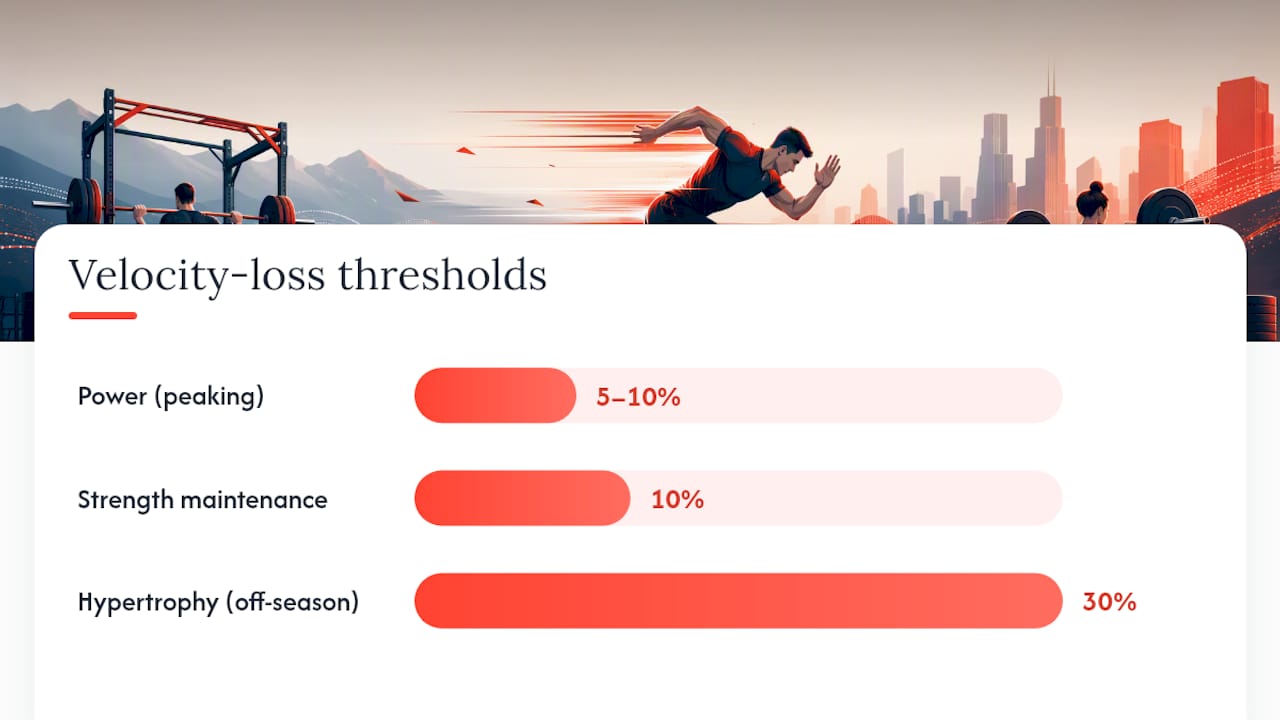
A brief session template makes the differences concrete. A peaking-phase power session might prescribe back squats at 70% load, stopping each set the instant velocity drops 8% from the first rep, typically after just 3 to 4 reps, with full recovery between sets. A strength-maintenance session in-season might allow a 15% loss on the same lift, extending sets to 5 or 6 reps before termination. A hypertrophy-focused off-season block might push to 30% loss, letting sets run to 10 or more reps with markedly more accumulated fatigue by design.
Always set your VLT relative to the fastest rep in the set, not the first. Athletes sometimes grind the opening rep after a heavy warm-up, and anchoring to a slow first rep will let the rest of the set run longer than intended, quietly defeating the purpose of the threshold.
Applied research on VLTs has reported meaningful volume savings without sacrificing outcomes, with some eight-week interventions using a a threshold showing favourable strength and power results while cutting the total number of repetitions performed. That’s the real practical case for VLTs: they let you train hard without over-training, because the stopping point is dictated by what the athlete’s body is actually doing that day, not a fixed rep scheme written weeks in advance.
6How do you use velocity data for day-to-day autoregulation?
Velocity based training earns its place in a programme when it becomes part of the daily decision-making, not just a testing-day exercise. The clearest entry point is the warm-up.
Have the athlete perform their standard warm-up sets at fixed, known loads, and compare today’s velocity against their established baseline for that load that helps optimize coaching workflows. If velocity comes in notably slower than expected, notably below baseline, that’s a signal the planned working load may need reducing to keep the session’s actual intensity aligned with the athlete’s readiness rather than the number written on the programme. If velocity comes in faster than expected, a small upward adjustment can be justified to avoid under-training a day where the athlete is clearly primed.
This small adjustment rule is deliberately conservative. It’s not designed to rewrite the programme; it’s designed to nudge it toward reality on days where the gap between planned and actual readiness is large enough to matter.
The same logic scales to team settings, which is where VBT often earns its keep fastest:
- Warm-up velocity checks across a squad flag individual athletes who are carrying fatigue, even when they report feeling fine subjectively.
- Group-level velocity trends across a week can reveal whether an entire training block accumulated more fatigue than planned, prompting a deload before it shows up as injuries.
- Athletes who consistently under-perform their expected velocity at fixed loads become an early flag for recovery, sleep, or life-stress conversations, well before performance markers or injury reports would catch it.
- Session-by-session logs build a longitudinal picture that a single testing day never could.
Within a periodised structure, VBT slots in as a monitoring and adjustment layer rather than a replacement for the periodisation model itself. A block periodisation approach might use velocity zones to define each block’s intent: faster target velocities and tighter VLTs during a power block, slower targets and wider VLTs during an accumulation block. Undulating models can use daily velocity checks to decide, in real time, whether a “heavy day” and a “light day” actually swap places based on what the athlete’s bar speed shows that morning. VBT doesn’t tell you what your periodisation model should be; it tells you whether today is behaving the way your model assumed it would.
7What does a VBT test day and session actually look like?
Getting from theory to a usable Monday-morning protocol comes down to a repeatable structure you can run every week without reinventing it each time.
Test-day checklist:
- Confirm the athlete is rested, fed, and free from acute soreness that would distort baseline numbers.
- Set up the device on the specific exercise being profiled, checking attachment placement matches previous sessions exactly.
- Run a full warm-up, then select 3 to 5 submaximal loads spread across roughly 40% to 90% of estimated 1RM.
- Record 2 to 3 reps per load, taking the best velocity reading at each load for the profile.
- Log the session immediately, ideally into the same spreadsheet or software used every week, not a scrap of paper.
Session workflow rules matter just as much as the testing protocol itself. Give the athlete live feedback after each rep where practical; seeing the number tends to improve intent and effort on subsequent reps. Apply your chosen VLT consistently within each set, stopping the set the moment the threshold is crossed rather than letting the athlete push “just one more” past the cutoff. Extend rest between sets if velocity on the first rep of a new set comes in noticeably below the session’s earlier working sets, since that usually signals accumulated fatigue that a fixed rest period didn’t fully clear.
Data logging doesn’t need to be complicated to be useful. At minimum, track these columns for every session:
- Date and exercise
- Load used (kg)
- Velocity recorded (m·s⁻¹), with metric specified (MV, MPV, or PV)
- Rep number within the set
- Set number within the session
- Subjective notes (sleep, soreness, stress) where available
Resist the urge to build a beautiful dashboard before you’ve got clean, consistent raw numbers. A simple spreadsheet with the six columns above, updated every session for eight weeks, will teach you more about an athlete’s trends than a sophisticated tool fed with two sessions of patchy data. For coaches building out their broader monitoring approach, Strength and Conditioning Education’s foundational course material covers how this kind of data logging fits into a wider athlete-monitoring system.
8Where does the evidence for VBT fall short?
VBT is well-supported for autoregulation and volume control, but it has real limitations worth understanding before you treat any single number as gospel.
Device error margins are the most immediate concern. Even good devices carry measurement noise, and that noise is rarely evenly distributed: accelerometer-based tools in particular can show reduced consistency at slower speeds, which is exactly the velocity range you’re relying on most heavily when estimating a 1RM. Low-velocity measurement is the hardest zone to get right on almost every device class, precisely where V1RM decisions live.
Generalisability is the second issue. A load–velocity profile built on one exercise, with one device, on one athlete, doesn’t transfer cleanly to a different lift, a different device, or a different athlete’s movement strategy. Estimates drawn from L–V profiling should be treated as useful approximations rather than certified maximums, re-checked periodically against real performance.
The most common implementation mistakes tend to be avoidable:
- Switching devices or metrics mid-block, which corrupts trend data without anyone noticing until the numbers stop making sense.
- Applying a textbook V1RM instead of measuring the athlete’s own.
- Anchoring VLTs to the first rep rather than the fastest rep in the set.
- Chasing a velocity target past the point of visible technical breakdown.
Sensible safeguards fix most of this: standardise your device and metric for an entire training block, validate any new tool against a trusted reference before trusting it with programming decisions, and log enough context alongside every velocity number (load, exercise, rep number, athlete state) that a number six weeks old still means something when you look back at it.
9How does Strength and Conditioning Education teach VBT in practice?
Velocity based training only becomes useful once a coach can build a profile, choose the right threshold, and read the data without second-guessing every number. That’s the gap between reading about VBT and actually running it well, and it’s where structured coach education earns its keep.
Strength and Conditioning Education’s course material is built with input from working industry professionals and covers exactly this territory: measurement principles, load prescription methods, and how autoregulation tools like VBT sit inside a genuine periodised programme rather than replacing it. The NSCA-endorsed pathway gives graduates a credential recognised across professional sport settings, backed by lifetime access to course resources, direct tutor support, and a peer network of coaches solving the same programming problems.
If you’ve read this far because you’re serious about applying velocity data properly, not just understanding it in theory, the Strength and Conditioning Fundamentals course is the natural next step for building that applied skill set out fully.
10Ready to apply velocity based training with confidence?
Reading about load–velocity profiles and VLTs is one thing. Running them accurately, on a real athlete, under real time pressure, in a real gym, is where most coaches discover the gaps in their knowledge.
Strength and Conditioning Education’s Strength and Conditioning Fundamentals course walks you through exactly this kind of applied measurement and programming skill, built by industry professionals and structured from beginner to advanced levels so you can start wherever your current knowledge sits. It comes with lifetime access to resources, dedicated tutor support, and a peer network of coaches you can compare notes with. Graduates have gone on to coaching roles within professional sport, which says more about the practical grounding of the material than any marketing copy could. If you’d rather explore the full route first, the course catalogue lays out every pathway, including the NSCA-endorsed certification for coaches aiming at the professional level.
11Where can you read more on velocity based training?
For coaches who want to go deeper into the primary literature behind this guide, these sources cover the methodology and evidence in more technical detail.
- The role of VBT in enhancing athletic performance, a peer-reviewed review covering implementation methods and velocity-loss evidence.
- Velocity-based training: a critical review, examining the accuracy and limitations of load–velocity 1RM estimation.
- Topics in Exercise Science and Kinesiology: VBT overview, comparing device classes and measurement precision.
- University of Montana thesis on VBT, focused on autoregulation and applied readiness monitoring.
- VLT and autoregulation literature, detailing fatigue-monitoring thresholds during training sets.
12Is VBT overrated or genuinely underused?
The gap between what VBT promises and what most coaches actually do with it is bigger than the marketing suggests. Plenty of gyms now own a velocity device that sits in a drawer after the novelty testing session, because nobody built the habit of logging data every week.
The evidence supports a narrower, more useful claim than “VBT optimises your training.” It supports this: velocity gives you an honest, same-day readiness check, and velocity-loss thresholds give you a defensible way to stop a set before junk volume accumulates. That’s genuinely valuable, and it doesn’t require expensive equipment or a physics degree to use well.
Where conventional advice falls short is treating V1RM and load–velocity profiles as fixed truths rather than estimates that need periodic re-checking. Prioritise consistency of measurement over precision of equipment first. A cheap device used the same way every week beats an expensive one used inconsistently.
13Frequently asked questions about velocity based training
What is velocity based training in simple terms?
Velocity based training measures how fast a bar moves during a lift and uses that speed, rather than a fixed percentage of your one-rep max, to decide the load and volume for that session.
Do I need expensive equipment to start VBT?
No. IMU-based wearables and camera apps offer a workable entry point, provided you validate them against a trusted reference and use them consistently. Precision matters less than repeatable, consistent measurement.
How often should I re-test an athlete’s load–velocity profile?
Most coaches re-check profiles every 4 to 8 weeks, or after a training block that would plausibly shift strength qualities, since V1RM and the profile’s slope can change as the athlete adapts.
Can VBT replace percentage-based training completely?
Not really, and it shouldn’t try to. Velocity works best as a daily adjustment layer on top of an existing periodised plan, correcting for readiness rather than dictating the entire programme structure from scratch.
